|

|
DataShare Metro Richmond
Bridging the Gap ... Data Serving Us All
|
|
|
|
|
|
|
| |
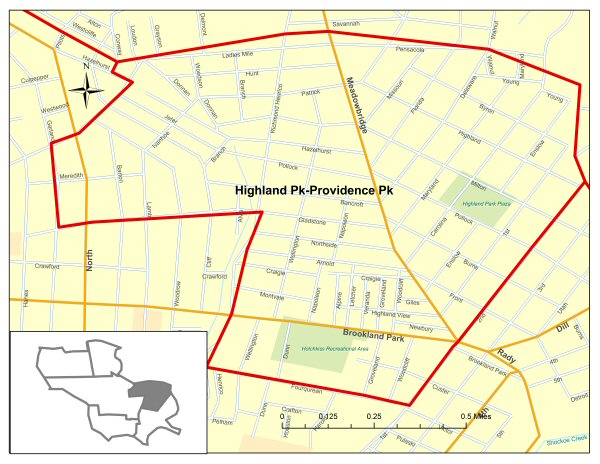
People And Families Data for Highland Pk-Providence Pk
 Please note: Large Map images are approximately 800 Kb - 1 Mb in size. Please note: Large Map images are approximately 800 Kb - 1 Mb in size.
| |
| Total |
5,823 |
197,790 |
7,078,515 |
| Male |
46.25% |
46.38% |
49.01% |
| Female |
53.75% |
53.62% |
50.99% |
| |
| Total Hispanic |
64 |
5,239 |
327,273 |
| White alone |
7.81% |
26.88% |
46.76% |
| African American alone |
92.19% |
12.56% |
3.87% |
| Asian/Native Hawaiian/Other Pacific Islander alone |
0.00% |
1.57% |
0.69% |
| American Indian/Alaska Native alone |
0.00% |
0.65% |
0.59% |
| Other alone |
0.00% |
50.89% |
38.96% |
| Two or more races |
0.00% |
7.46% |
9.13% |
| Total Non Hispanic |
5,759 |
192,551 |
6,751,242 |
| White alone |
2.93% |
38.84% |
73.53% |
| African American alone |
95.88% |
58.16% |
20.31% |
| Asian/Native Hawaiian/Other Pacific Islander alone |
0.12% |
1.28% |
3.82% |
| American Indian/Alaska Native alone |
0.07% |
0.25% |
0.30% |
| Other alone |
0.45% |
0.16% |
0.16% |
| Two or more races |
0.54% |
1.30% |
1.88% |
| |
| Total Population |
5,823 |
197,790 |
7,078,515 |
| Less than 5 years old |
4.69% |
6.27% |
6.49% |
| 5-11 years old |
12.19% |
9.04% |
9.90% |
| 12-17 years old |
9.15% |
6.55% |
8.13% |
| 18-24 years old |
6.18% |
13.14% |
9.55% |
| 25-44 years old |
25.49% |
31.82% |
31.78% |
| 45-64 years old |
24.52% |
19.79% |
22.98% |
| 65-74 years old |
11.27% |
6.73% |
6.14% |
| 75 years old and older |
6.51% |
6.67% |
5.03% |
| |
| Total families |
1,457 |
44,225 |
1,859,983 |
| |
| Total number of families with children 18 years or younger |
516 |
20,019 |
897,563 |
| Female householders (no husband present) with children under 18 |
58.72% |
49.40% |
20.25% |
| Male householders (no wife present) with children under 18 |
9.50% |
7.44% |
5.62% |
| Married households with children under 18 |
31.78% |
43.15% |
74.13% |
| |
| Population 15 years old and older |
4,618 |
160,809 |
5,623,628 |
| Never married |
38.07% |
40.94% |
26.19% |
| Married |
37.12% |
38.93% |
58.61% |
| Divorced |
11.76% |
11.52% |
8.97% |
| Widowed |
13.06% |
8.61% |
6.23% |
| |
| Total Population |
5,823 |
197,790 |
7,078,515 |
| Native (born in or outside of U.S.) |
99.64% |
96.14% |
91.94% |
| Foreign Born |
0.36% |
3.86% |
8.06% |
| Total Foreign Born |
21 |
7,643 |
570,279 |
| Naturalized |
66.67% |
35.52% |
40.82% |
| Not a citizen |
33.33% |
64.48% |
59.18% |
| |
| Population 5 years old and older |
5,550 |
185,379 |
6,619,266 |
| Lived in same house in 1995 |
63.23% |
47.97% |
52.17% |
| Lived in different house, same county in 1995 |
28.47% |
25.27% |
18.08% |
| Lived in different county, same state in 1995 |
5.87% |
15.74% |
14.23% |
| Lived in different county, different state in 1995 |
0.09% |
2.23% |
2.99% |
| Elsewhere in 1995 |
2.23% |
8.73% |
12.41% |

|
|
|
© 2010 DataShare Metro Richmond Hosted by Virginia Commonwealth University
|